This post on the election of 2016 picks up where my last post left off. A quick note: in this series, I am using voting data for Presidential elections from the United States Census Bureau as much as I can to make sure all my data is coming from the same source. There may be other sources that have slightly different data, but the margin of error is acceptable for these purposes. To derive the numbers associated with the candidate vote totals, I am using data from 270towin.com, which is a well-regarded election-oriented site.
The Election of 2016
By all traditional metrics, the 2016 presidential election should have been a fairly pedestrian affair. The economy was steadily and strongly improving, there were no serious foreign entanglements causing undue heartburn—hell, even Iran had agreed to give up its nuclear weapons. Were there missed opportunities, and reasons to criticize Obama? Absolutely.
And so Democrats and most of the punditry looked forward to the election of America’s first woman President in the form of Hillary Clinton, a campaigning centrist who managed to look to the left enough to follow the generally accepted formula for a Democrat to win just enough votes in the right places.
But the 2016 election was destined to be one for the ages. On the Democrat side, Bernie Sanders—the Left’s favorite cranky grandpa—came out of nowhere to cause enough trouble with his one-issue campaign (blame Wall Street) from the flanks to weaken enthusiasm for Clinton once she secured the Democrat nomination.
(Full disclosure, I voted for Sanders in the Texas primary to send a message to Democrats that they did indeed need to pay attention to liberal concerns. I also have had my qualms with Clinton as a politician, and wish she’d not be quite so centrist. That, however, did not prevent me from enthusiastically voting for her on election night.)
And the Republican side, jammed with establishment and dynastic candidates (and one insane fascist goon), descended into policy-bereft penis-measuring contests sprinkled with naked nativism. Out of the carnage emerged the fascist goon, made of the slipperiest Teflon. Donald Trump became the Republican candidate.
The election pitted two of the least-liked candidates in America’s history, and it was a brutal, vicious, and vile contest. It also featured unprecedented controversies, from James Comey’s insertion into the narrative with stuff about The Emails, to Trump’s admission on tape that he sexually assaulted women. (C’mon. Seriously. That wasn’t just locker room talk, and you know it.) The whole Russia thing was poorly understood (and still is, and I’ve purposefully avoided talking much about it because it’s so problematic) and the full measure of Trump’s orbital corruption was barely considered.
That’s Why We Hold Elections
Despite Sanders’ challenge from the left flanks, Clinton’s campaign seemed to be running as smoothly as an RV heading across Kansas. So smoothly, she even forgot to go to Wisconsin…
By comparison, Trump’s campaign was alternately a motorbike darting through rush hour and a bonkers jalopy trying to launch jumps over potholes. Since America is nominally a small-c conservative place, the assumption was that the boring, safe, ride would cross the finish line first. Even if it was a snoozy ride.
Yeah.
Well.

I’ve made the comment for a while now that Democrats took a nap after Obama got elected, figuring that everything that needed to be accomplished was accomplished—America elected a black dude, so…it’s the end of History!
That strategy, unfortunately, led them to ignore or explain away a 5 million voter decrease in 2012 from 2008, and it had led to the loss of both chambers of Congress, along with thousands of seats across the country. In other words, Democrats were complacent heading into election night 2016, and paid the price for it. They also grossly failed to comprehend the resurgence of nationalism on the Right.
The Numbers
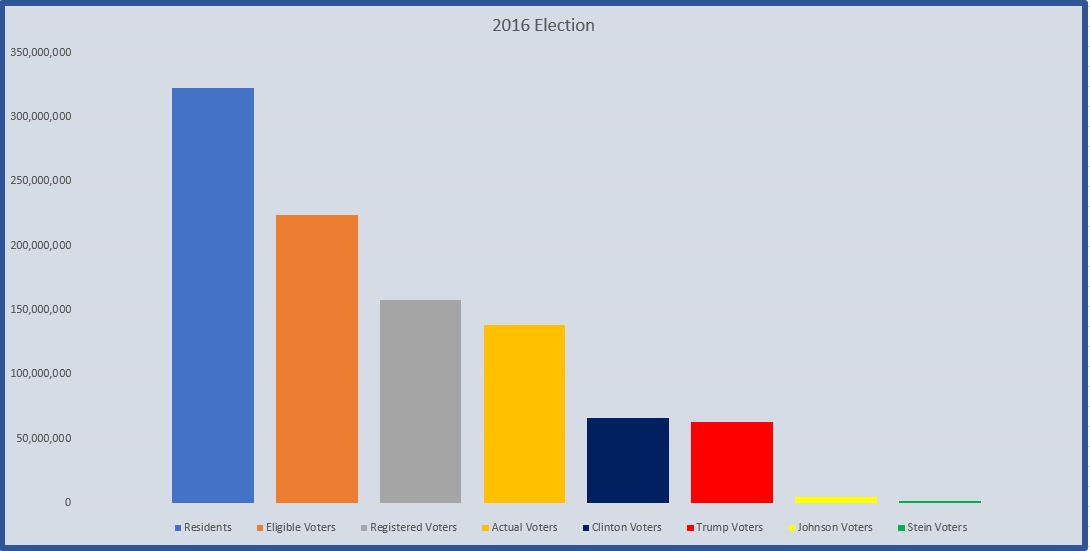
The population of the United States in 2016 was approximately 323 million, with 224 million people eligible to vote, or 69% of the total population. The number of people who registered to vote rose from 153 million in 2012 to 158 million, an increase of 5 million, but it represented a sagging percentage of registered voters. Whereas the registration rate was 71% in 2012 (and 72% in 2004), it was 70% in 2016.
Voter turnout improved from 2012, from 131 million to approximately 138 million. That turnout represented about 88% of registered voters, and 62% of eligible voters. These rates showed an increase from 2012, but the results were drastically different.
Hillary Clinton received 65,845,063 popular votes—a slight increase from Obama’s totals in 2012—but only 227 electoral votes. Donald Trump received 62,980,160 popular votes—nearly 3 million more than Mitt Romney—and ended up with 304 electoral votes. (Yes, that’s right: those two totals don’t add up to 538. The electoral college, being a bizarre institution, had 7 faithless electors who cast votes for Colin Powell, John Kasich, Ron Paul, Bernie Sanders, and Faith Spotted Eagle).
Additionally, whereas in 2012, Gary Johnson received a relatively insignificant 1.4 million popular votes, he received nearly 4.5 million popular votes in 2016. Even Jill Stein received nearly 1.5 million popular votes. Evan McMullin, looking to be a spoiler in Utah, got nearly 728 thousand votes. It was a fractious election, is what I’m saying.
Anyway, here’s your chart:
Clinton won nearly 3 million more popular votes than Trump, but received 77 fewer electoral votes. What made things even harder to deal with was that that winning margin was clawed out in three states which Trump managed to win by a scant 100,000 votes or so. The difference in 2016, in our very weird system, came down to .07% of all votes cast in the election.
The country barely handled Bush’s victory in 2000, but it was rationalized because of low voter participation; because Al Gore was a genuinely earnest individual—but had been painted as an annoying, sighing, pedant; because George W. Bush seemed relatively harmless due to malapropisms–but seemed like someone you could have a beer with, even if he was drinking tea; because the vote difference between the two candidates was only about half a million. Basically, either could have one, and there would be recriminations either way.
Can This Be Fixed?
What to do, though, when the difference in popular votes in 2016 was nearly 3 million? That’s basically the entire population of the San Antonio and Austin corridor whose choice in President was effectively nullified.
And it gets even more frustrating when you take a look at the American Voter Bot on Twitter, which sends out a profile of public opinion one real voter at a time. It makes you grind your teeth when you see something like “I’m a 19 year old, non-college-educated, Asian man from CA. I’m a liberal Democrat who supports raising the min. wage, always supports abortion, supports the ACA, and opposes mandatory minimums. I didn’t vote in 2016.”
But then you remember he’s in California, so his vote wouldn’t, on the margins, have changed the outcome anyway. Yes, his vote would have increased the popular vote total for Clinton, but it would not have changed the outcome. Because of the electoral college.
But the electoral college isn’t the only problem, and I’ll definitely be addressing it later.
Time for Another Chart
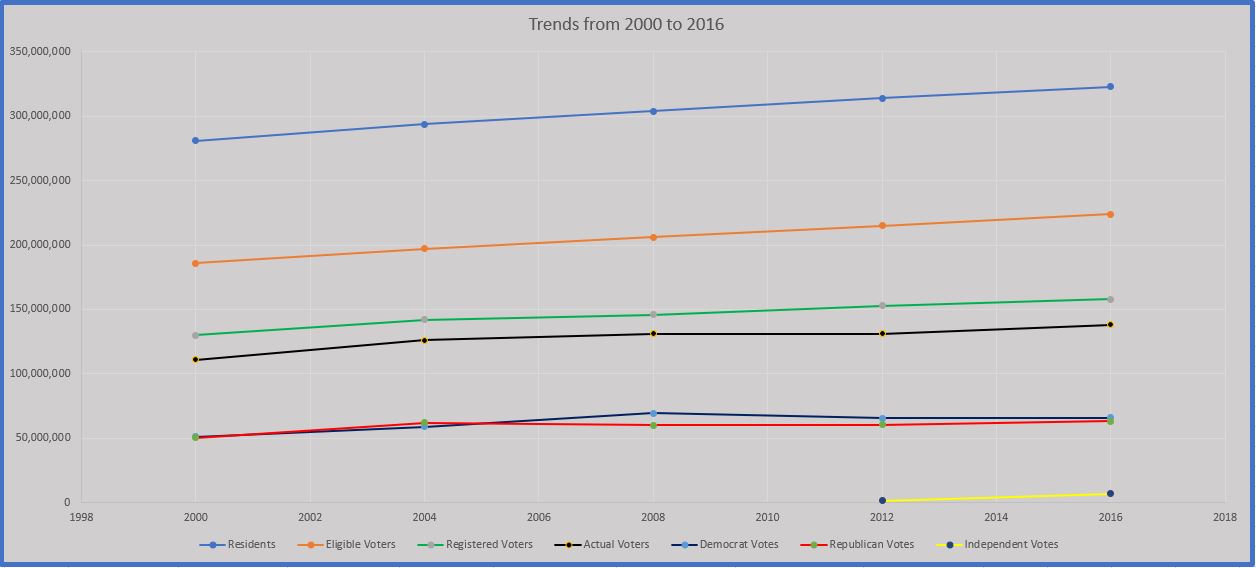
From 2000 to 2016, the Resident population increases in pretty much a straight line (the soft-blue line in the chart above). So does the voting-eligible population (the orange line). There’s a large gap between the Resident population, and eligible voters. But, like I said the first time looking at this stuff, that’s just how it is. There is always going to be some segment of the population who are under the age of 18, and some who are not citizens and thus are not eligible to vote. So there’s always going to be a gap. Nonetheless, their growth rate are just about equal.
Below the orange line are the registered voters (The green line). It’s a little harder to tell, but, while it’s increasing over time, it does so at slightly shallower rates than blue and orange lines. As time goes on, the gap between those who could be registered to vote and those who actually do so begins to widen.
Just below the registered voters are the actual voters (the black line). That line is a tad more volatile, but shows how many registered voters actually vote. Getting near-total participation out of the registered voters would make a difference of 12-15 million votes. And that would definitely help provide a purer view of the population’s preference for a candidate.
Speaking of popular preference, it’s interesting to see that both party’s candidates tend to be essentially evenly matched, with the biggest gap occurring in 2008. I have a feeling I’ll be coming back to this.
Increasing Registration Could Help
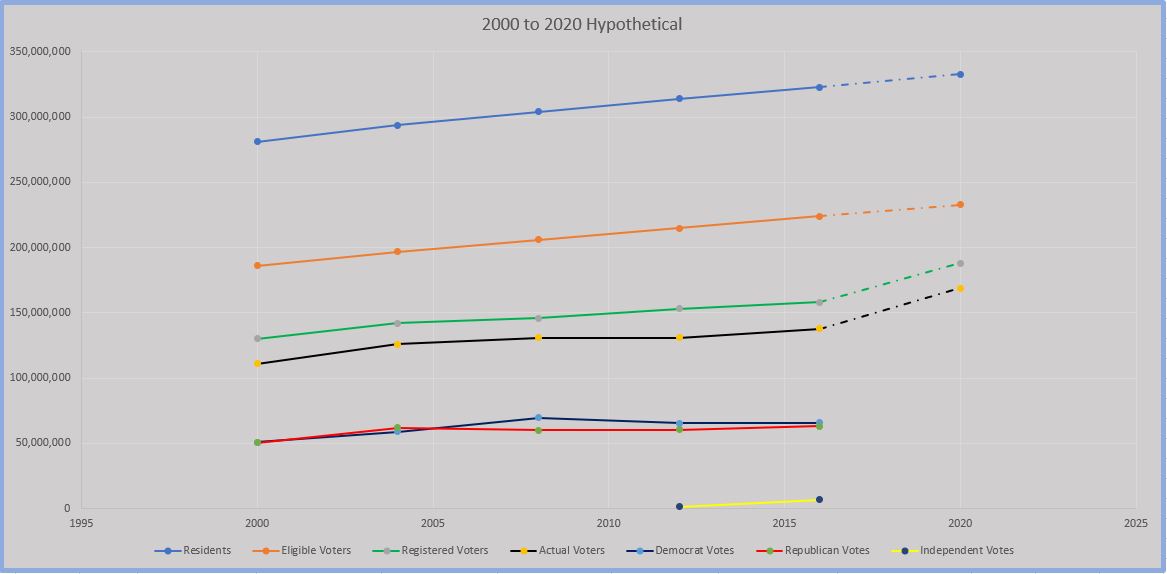
All this is to say, I’m certainly not the only person who has looked at this data and seen that the biggest impact in an election is to increase registration rates since those who register tend to be about 85-90% likely to actually vote. Just look at how things would be different in 2020 if, instead of adding just 5-10 million more registered voters to the mix, an additional 30 million registered voters were added to the mix.
Voter Registration over the Past 100 Years
That 19% increase would be … not bad at all!
It would also be incredibly unheard of.
More typical rates over the past 16 years are 2-9% increases in registered voters. You’d have to do anywhere from two to five times better at your registration efforts to increase registration rolls by 30 million by 2020.
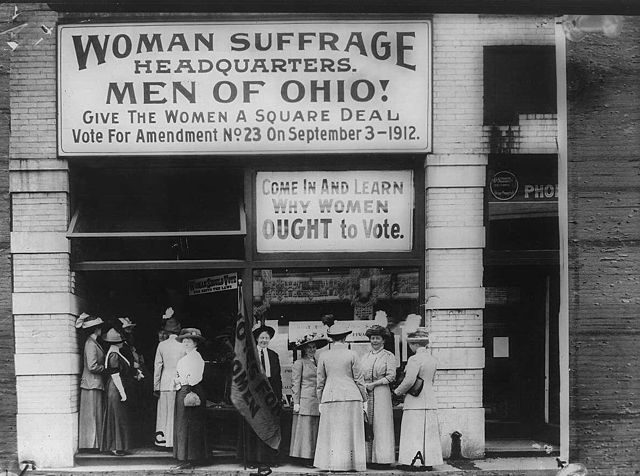
Unfortunately, absent the introduction of a previously-barred category of citizen entering the voting-eligible population, such as when women won suffrage, or when Jim Crow laws were struck down, you almost certainly won’t see that kind of increase. Again, one would think that registration should be automatic upon eligibility. But it isn’t, and lots of resources and energy have been spent over the years to increase registration rates. And yet, just take a look at rates since 1968.
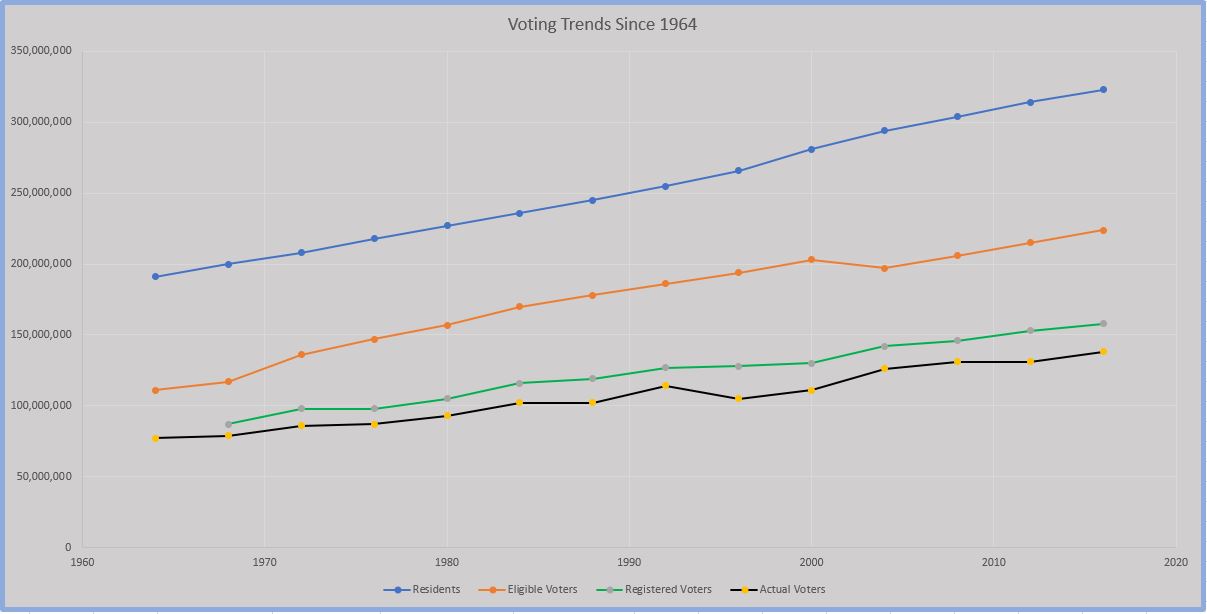
Admittedly, I think there’s weird data there. That mound from 1968 to 2004 in the amount of eligible voters stands out, and and even though I’m using Census data, maybe there was a change in the way the census calculated resident population during those years. Nonetheless, it’s still clear to see that the gap between registered voters and eligible voters has been wide for a long time. Efforts to close that gap have done almost nothing in the past 50 years. In fact, if anything, it’s widened. It is reasonable to suspect that not much will change any time soon. Likewise, the trend of actual voter turnout is fairly steady, other than the slump years of 1976, 1988, 1996, and 2000. In general, about 60-some-odd percent of people who could vote actually do so, and that’s basically the way it’s been for the past 50 years.
So, what to do about it? Well, that’ll come next in this series.
