Part 2 of a Multi-Part Series Looking at Voting in the United States
This post picks up where my last post left off. And as I warned in my last post, it’s data-heavy. A quick note: in this series, I am using voting data for Presidential elections from the United States Census Bureau as much as I can to make sure all my data is coming from the same source. There may be other sources that have slightly different data, but the margin of error is acceptable for these purposes. To derive the numbers associated with the candidate vote totals, I am using data from 270towin.com, which is a well-regarded election-oriented site.
The election of 2000 resulted in Bush becoming President, even though he squeaked out an Electoral College victory despite losing the popular vote by a scant 500,000 votes. In 2000, the resident population of the United States was approximately 281,000,000 people. By 2004, that number had, according to the United States Census Bureau, increased almost seven per cent to 294,000,000.
The Election of 2004
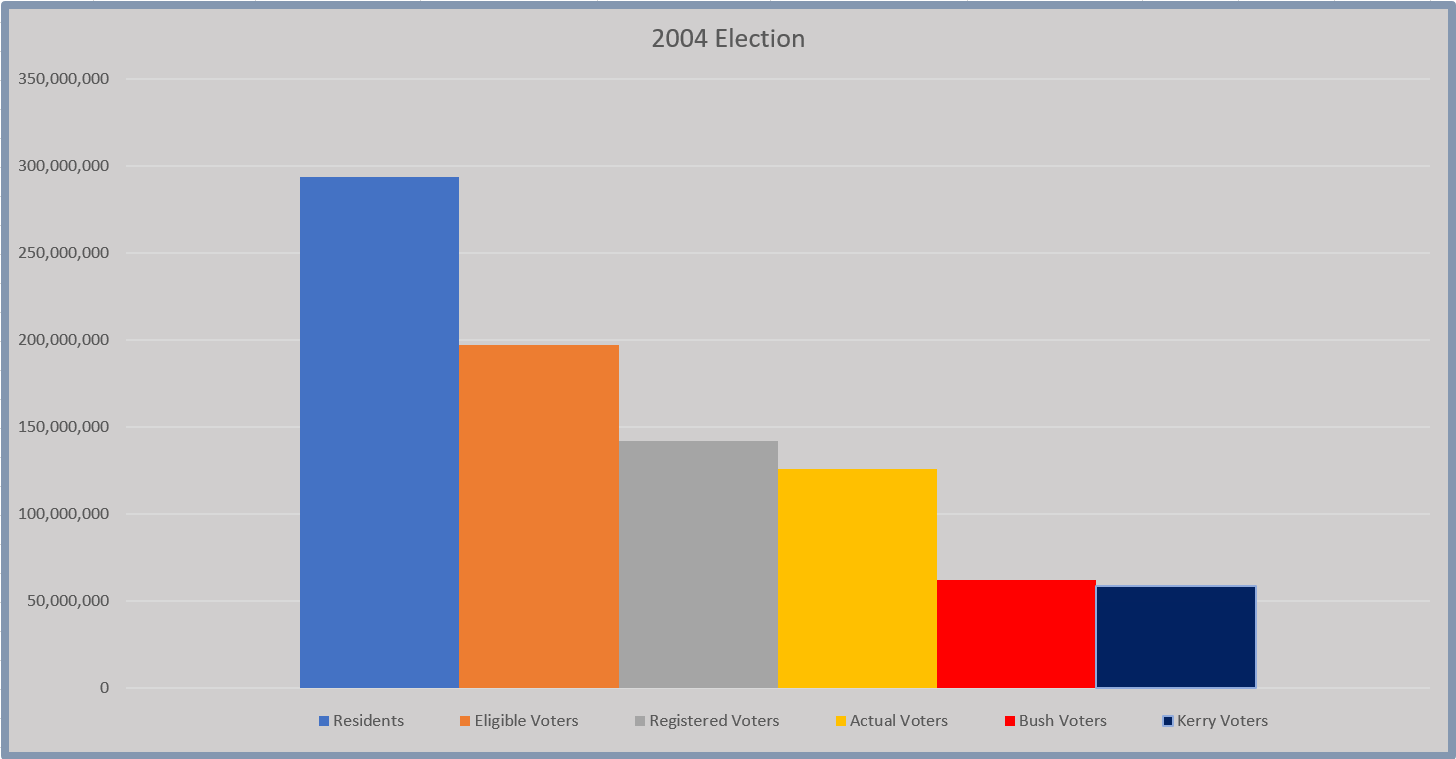
The election of 2004 pitted the éminence grise John Kerry against George W. Bush, and–without getting into the Swiftboating controversies and the accusations that a significant portion of Democrats saw the Bush administration as a proto-fascist cabal–it was a contentious war-time election season.
While the resident population of the United States comprised approximately 294 million people, there were only 197 million eligible to vote. Again, that meant about 67% of the country would be making decisions affecting the entirety. As will happen. As we’ll discuss later, there are a few ways to increase that ratio, but any increase will be relatively minimal.
Of that eligible population, only approximately 142 million were registered to vote, which is about 72%. That is 55 million people who could have registered to vote, but didn’t. Nonetheless, the uptick demonstrates the efforts made to increase registration, but it still shows that less than half the country (48%) were heading out to make decisions about who would represent everyone.
Of that registered population, 126 million ended up voting, or 88% of those registered, but only 64% of those who were eligible. 16 million registered voters or 71 million eligible voters stayed home. Still and nonetheless, this was a higher turnout than 2000 to be sure (remember, 19 million registered voters stayed home in 2000), and it reflected the passions that surrounded the 2004 election.
In the end, George W. Bush received 62,039,073 popular votes and 286 electoral votes, while John Kerry received 59,027,478 popular votes and 251 electoral votes. Charted out, again, it’s plain to see how the winner of the election represented only 21% of the entire population. Which was better than in 2000, but still illustrative of voter disgruntlement.
The 2008 Election
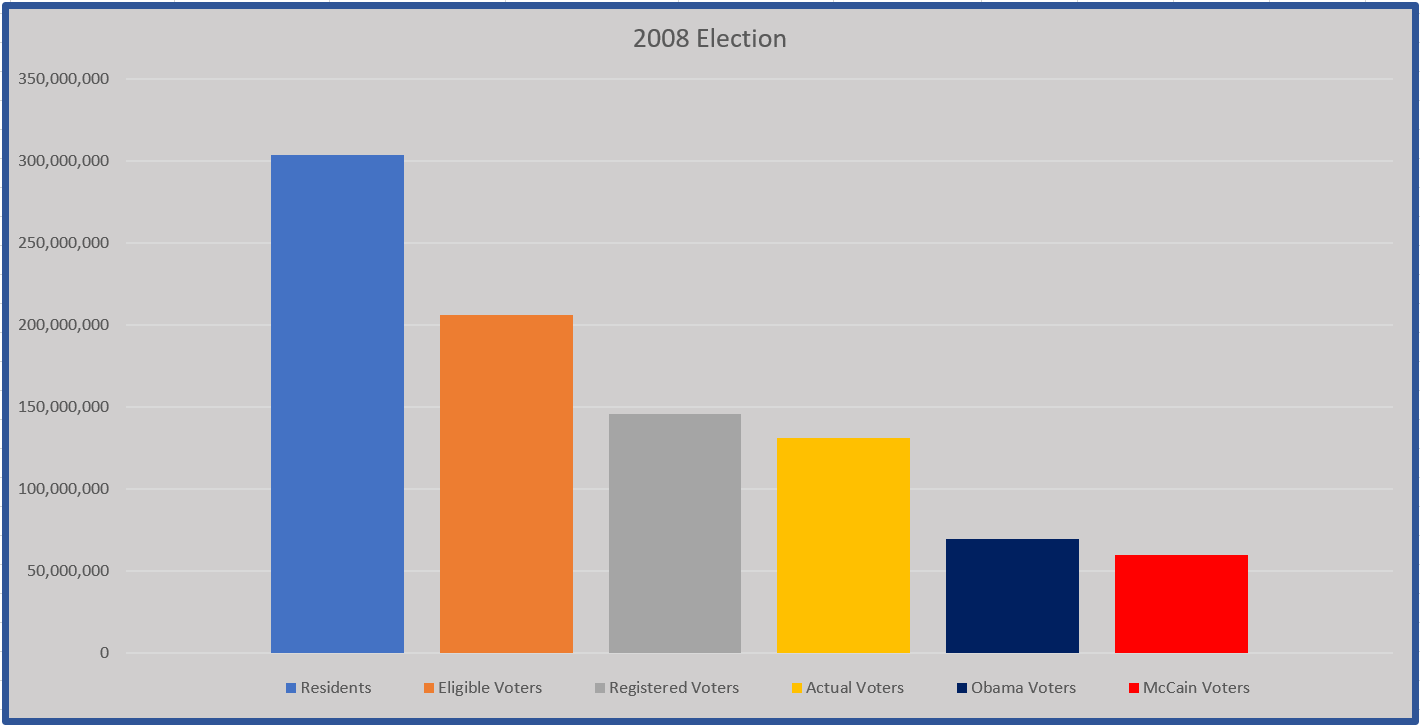
By 2008, with the economy in shambles and the wars in Iraq and Afghanistan stagnating, the country seemed ready for a change. The total resident population in the United States in 2008 was approximately 304 million, with approximately 206 million eligible voters. Once again, about 67% of the total population.
Voter registration rates actually sagged in 2008 from 2004 levels. Of the 206 million eligible voters, only 146 million were registered, which is an increase of 4 million voters, but represented only 71% of eligible voters. On election day of 2008, 131 million voters turned out, which is nearly 90% of the registered voters, but only approximately 64% of eligible voters. In other words, 15 million registered voters (75 million eligible voters) stayed home.
The results were much different than in 2004, however. Barack Obama received 69,456,897 popular votes and 365 electoral votes, while John McCain received 59,934,814 popular votes and 173 electoral votes. Despite this discrepancy in the popular and electoral votes, once again, the winner amounted to approximately 22% of the entire population, not terribly different than the rate associated with the winners of the previous elections. Again, a chart is illustrative.
A Slight Tightening in 2012
By 2012, with the country still hurting from the effects of the recession and broad controversies over the Affordable Care Act, the conventional wisdom was that Obama might be the first one-term President since George H.W. Bush. This didn’t happen, but his support did sag.
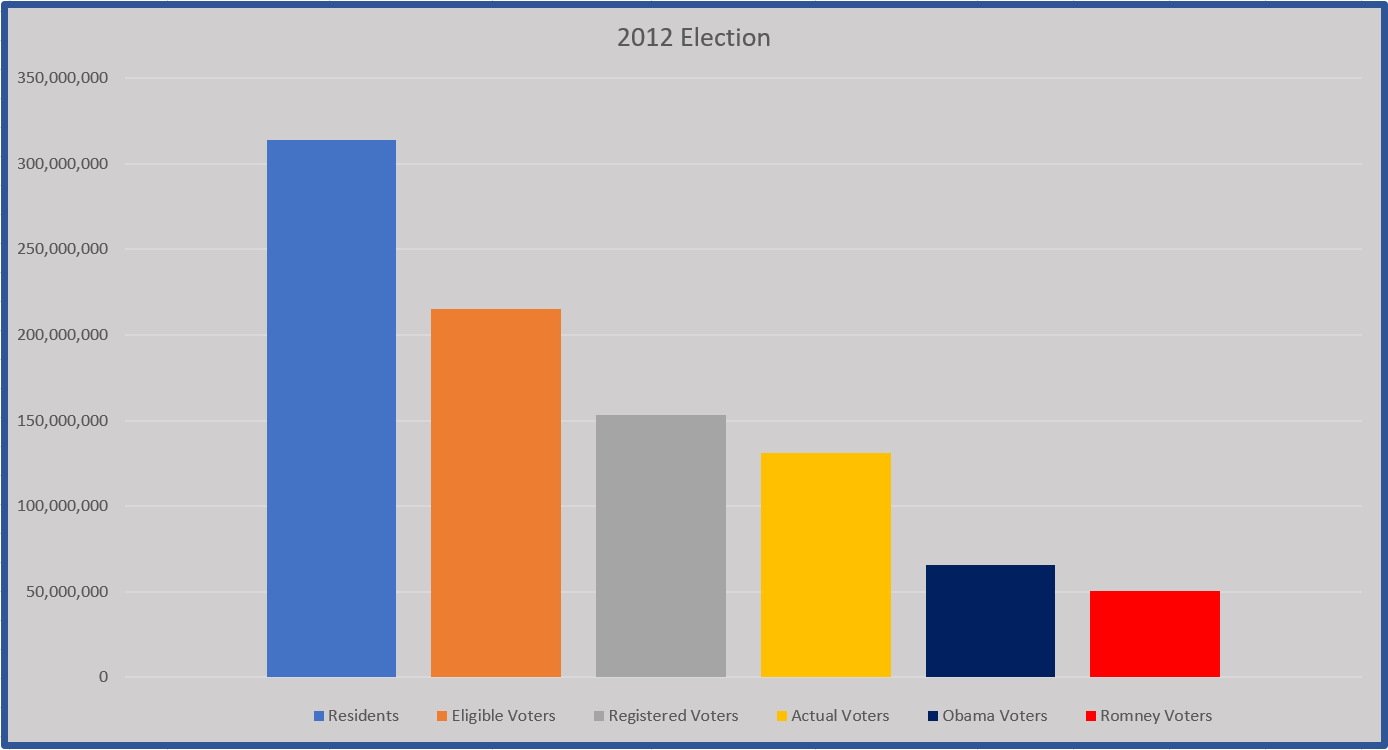
The total resident population in 2012 was approximately 314 million, with approximately 215 million eligible voters. That is about 68% of the population, slightly higher than previous years, but close enough to 2/3 to be pretty much the same. Of those 215 million eligible voters, only 153 million were registered, which is an increase of seven million, but represents the typical 71% rate of registered voters versus eligible voters.
While the 2012 race between Obama and Mitt Romney seemed tight during the campaign, on election day, Obama received 65,446,032 popular votes and 332 electoral votes. Mitt Romney, by contrast, received 60,589,084 popular votes and 206 electoral votes. What should have been alarming, however, is that the voter turnout rate sagged significantly in 2012. Only 131 million came out to vote in 2012, which was essentially the same number that came out in 2008. But because the population had grown in the intervening four years, that 131 million represented 22 million registered voters—84 million eligible voters–who didn’t come out to vote.
Participation rates, therefore were lower. That 131 million represented a decrease to 85% turnout amongst registered voters, and 61% amongst eligible voters. Still better than 2000 and 1996, but worse than 2004 and 2008. And again, the winner represented only about 21% of the entire population.
Let’s have a chart:
The next post in this series will look at the 2016 election, where we stand now that we’re heading into midterms, and will move into talking about midterm elections in the United States, which are a lot more complicated than presidential elections.
